



Markets
S&P 500 Comparison: Crisis-to-Recovery Pattern
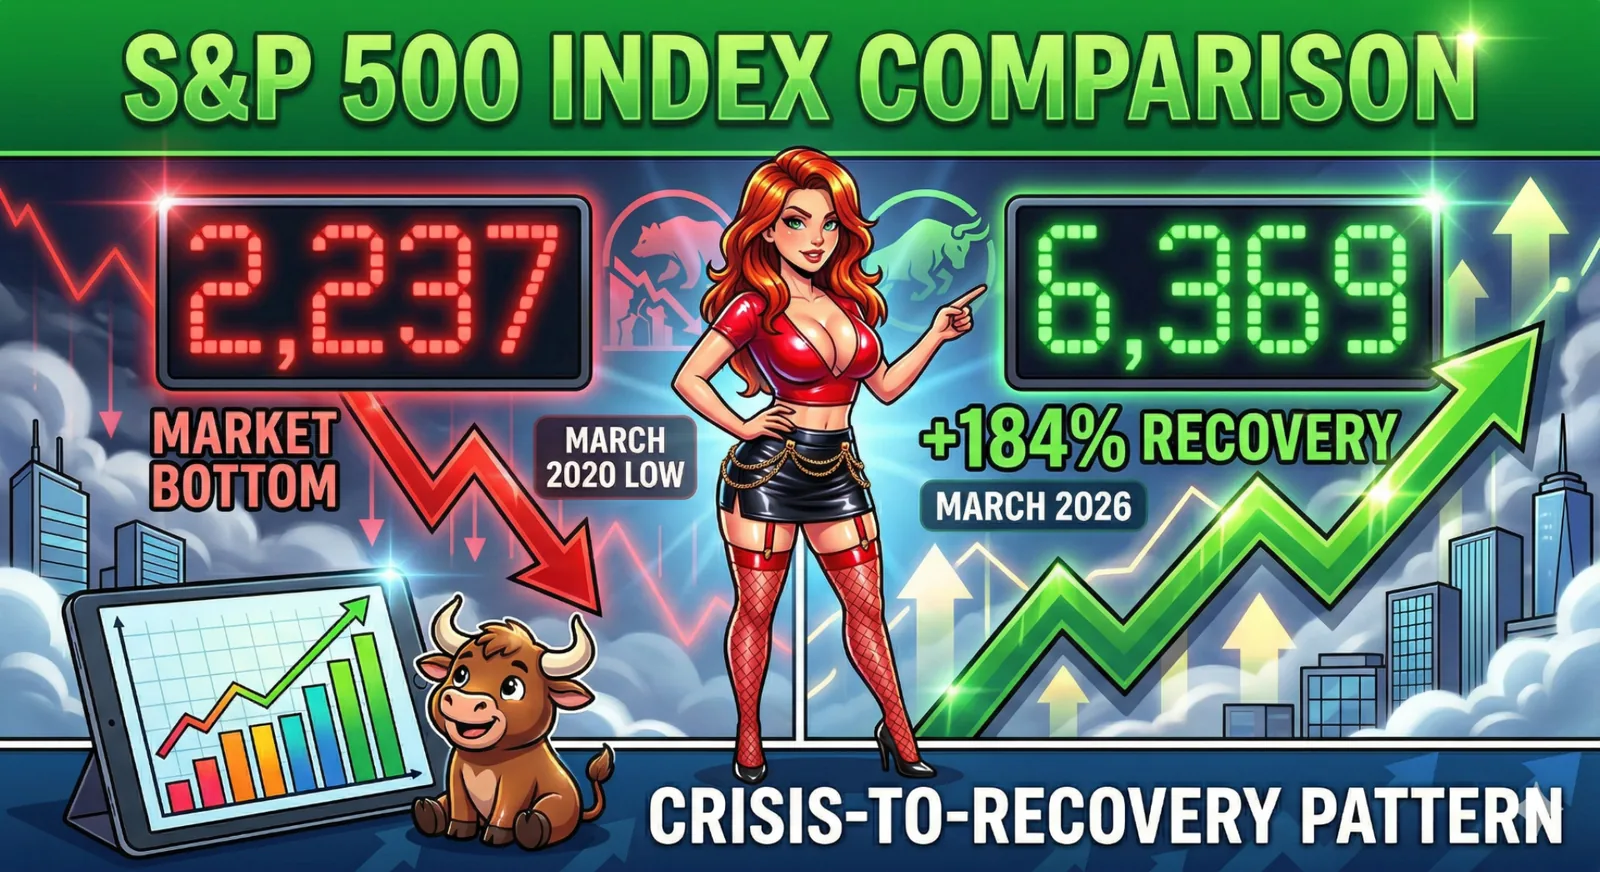
This infographic tracks the crisis-to-recovery path from the March 2020 low to March 2026, including the +184% rebound window.
Open visual Markets
This infographic tracks the crisis-to-recovery path from the March 2020 low to March 2026, including the +184% rebound window.
Open visual
Markets
This visual isolates the fast 2020 shock window, from peak to bottom in 23 days, and shows the early rebound through May 2020.
Open visual